Prometheus使用 Node Exporter 监控 Linux 主机指标
Prometheus
Node Exporter
暴露了大量与硬件和内核相关的指标。
在本指南中,您将:
-
在
localhost上启动 Node Exporter -
在
localhost上启动一个 Prometheus 实例,配置为从运行中的 Node Exporter 抓取指标
注意: 尽管 Prometheus Node Exporter 是为
*nix 系统设计的,但也存在 Windows exporter,用于 Windows 系统,功能类似。
安装和运行 Node Exporter
Prometheus Node Exporter 是一个单一的静态二进制文件,您可以通过 tarball 安装。从 Prometheus 下载页面下载后,解压缩并运行它:
1 | ``` |
INFO[0000] Starting node_exporter (version=0.16.0, branch=HEAD, revision=d42bd70f4363dced6b77d8fc311ea57b63387e4f) source=“node_exporter.go:82”
INFO[0000] Build context (go=go1.9.6, user=root@a67a9bc13a69, date=20180515-15:53:28) source=“node_exporter.go:83”
INFO[0000] Enabled collectors: source=“node_exporter.go:90”
INFO[0000] - boottime source=“node_exporter.go:97”
…
INFO[0000] Listening on :9100 source=“node_exporter.go:111”
1 |
|
curl http://localhost:9100/metrics
1 |
|
HELP go_gc_duration_seconds A summary of the GC invocation durations.
TYPE go_gc_duration_seconds summary
go_gc_duration_seconds{quantile=“0”} 3.8996e-05
go_gc_duration_seconds{quantile=“0.25”} 4.5926e-05
go_gc_duration_seconds{quantile=“0.5”} 5.846e-05
等等。
1 |
|
curl http://localhost:9100/metrics | grep “node_”
1 |
|
global:
scrape_interval: 15s
scrape_configs:
- job_name: node
static_configs:- targets: [‘localhost:9100’]
1 |
|
wget https://github.com/prometheus/prometheus/releases/download/v*/prometheus-*.*-amd64.tar.gz
tar xvf prometheus-.-amd64.tar.gz
cd prometheus-.
1 |
|
./prometheus --config.file=./prometheus.yml
通过 Prometheus 表达式浏览器探索 Node Exporter 指标
现在 Prometheus 正在从运行中的 Node Exporter 实例抓取指标,您可以使用 Prometheus UI(即表达式浏览器)来探索这些指标。在浏览器中导航到
localhost:9090/graph,并在页面顶部的主表达式栏中输入表达式。表达式栏如下所示:
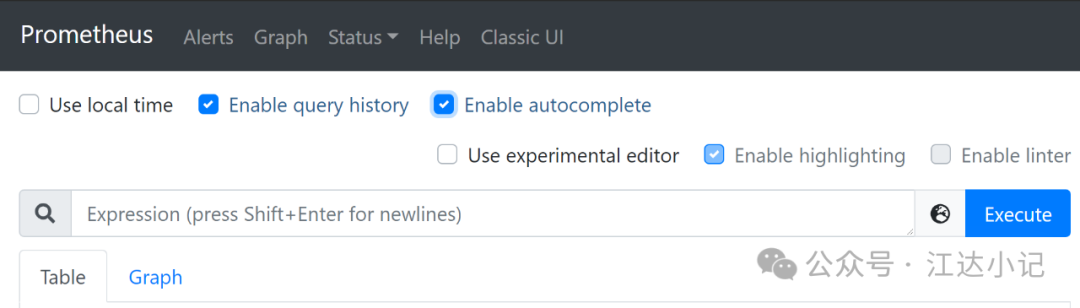
特定于 Node Exporter 的指标以
node_ 开头,包括
node_cpu_seconds_total 和
node_exporter_build_info 等指标。
以下是一些示例指标:
| 指标 | 含义 |
|---|---|
rate(node_cpu_seconds_total{mode="system"}[1m]) | 过去一分钟内,平均每秒在系统模式下花费的 CPU 时间(以秒为单位) |
node_filesystem_avail_bytes | 非 root 用户可用的文件系统空间(以字节为单位) |
rate(node_network_receive_bytes_total[1m]) | 过去一分钟内,平均每秒接收的网络流量(以字节为单位) |
本文档是开源的。请通过提交问题或拉取请求来帮助改进它。